Kubernetes is hard.
For most engineers, Kubernetes remains an intimidating framework to understand and work with. There are multiple resource types, from deployments to statefulsets, that go beyond the simple “container” concepts from the Docker world. There are complex topics like custom resource definitions (CRDs), and the myriad of plugins to handle everything from certs to autoscaling.
Did we mention Kubernetes is hard? Fear not.
You don’t have to be a Kubernetes expert to start seeing the benefits of the system and use it productively. . In this article, we will cover some of our favorite debugging tips so that you can become more comfortable with Kubernetes without having to annoy your DevOps or Infra friend…again.
Oh, and if you’re new to Kubernetes we recommend starting here.
Let’s Get Started #
Before you dive into the weeds of Kubernetes debugging concepts, take a step back and familiarize yourself with the observability tooling stack at your organization. It’s likely that the information you need is scattered across multiple tools. Let’s look at what some of those tools may be:
- Kubernetes dashboard from a cloud provider: If your team is using a managed Kubernetes offering from a cloud provider (e.g., AKS, EKS, GKE), you most likely have access to a Kubernetes dashboard via your cloud provider’s web console. This enables you to view the workloads, logs, and state of the system.
- Third-party observability tooling: You’ll likely have access to popular observability products (e.g., Datadog, Splunk, etc) that are collecting data about your cluster and applications.
- Open-source alternatives: If you’re not using a managed solution, i.e. you are running locally or on-prem, your cluster admin may have set up the official Kubernetes dashboard or some other open-source product (e.g., Lens).
- CD tools: Alternatively, you may have access to information via CD tooling like ArgoCD, Spinnaker, or Harness.
- Direct cluster access: Finally, you may have been given a service account or role to access the cluster directly to run `kubectl` commands yourself.
Take some time to explore these tools to find your application and cluster information.
Understanding Pod Lifecycle #
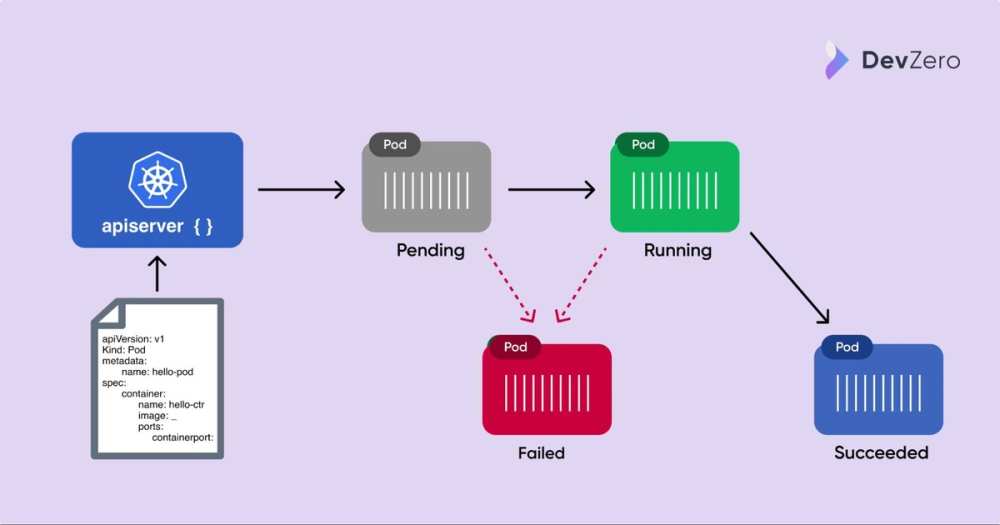
Next, in order to start debugging, we need to understand the lifecycle of a pod. At a high-level, your application that is packaged into a pod goes through the following phases:
- Pending: The Kubernetes control plane is setting up the pod to run on the nodes. This phase includes the time the pod is being scheduled to an available node as well as time spent downloading the Docker image.
- Running: The pod is scheduled to a node and at least one container in the pod is running (it can be starting or restarting).
- Succeeded: Pods have successfully terminated (after completing their lifecycle) without an error (e.g., a successful scheduled job completing).
- Failed: At least one container in the pod has exited with an error.

Pod lifecycle
Debugging from the Failed state is usually self-explanatory, but often things can go wrong while the Pod is Pending or Running and these issues are often much more challenging to debug. Let’s look a few common ways things break during the first two phases of a Pods lifecycle.
Note: there is another phase (`unknown`) that occurs when Kubernetes cannot determine the state of the pod. This error is most likely due to an infrastructure issue, so go ahead and ping your infra friends for help there.
Pod is Stuck in Pending #
First, if your pod is stuck in the pending state, you are most likely hitting some sort of resource limit. Most commonly, the pod is waiting to be scheduled while the cluster is still scaling up. You can check the logs for the autoscaler pods or Kubernetes system logs (be sure to check the containers in the kube-system namespace). You should also look at the monitoring dashboard to see how full each node is. If you have sufficient resources available on your nodes, you should then check to see if you are hitting against the ResourceQuota limits in your namespace. In this instance, your kubernetes system logs should provide a print out the generally indicates a “quota”.
If the issue is not resource or quota related, the error statement should guide you to the next place to look. Most likely, the issue is one of two things:
- The pod has timed out waiting for a persistent volume. Likely the persistent volume claim for your stateful components are unable to attach to a persistent volume due to it being scheduled to a different AZ (e.g., in the case of AZ-dependent resources like EBS volumes) or it could also be a permission error.
- ImagePullBackOff: Kubernetes ran into an issue pulling down the Docker image. This could be due to the wrong image name or tag. More commonly though, it’s an issue with authenticating to the registry holding your Docker containers. Check out this guide on how to pull an image from a private registry.
Pod is Running with Errors #
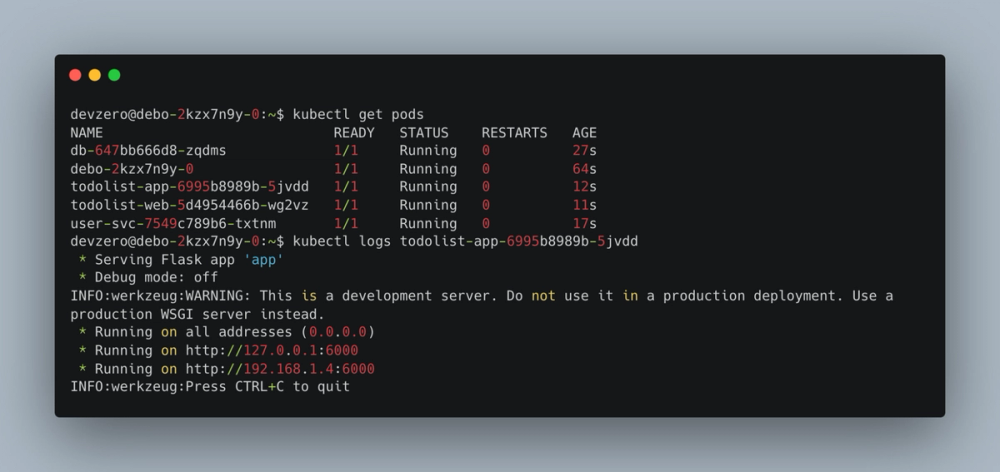
Once the pod is actually running, we can rely more on our traditional observability tooling to debug the issue. When issues are encountered, you should first inspect the logs of the pod. Sometimes if the container dies too quickly, it may be harder to find the logs. However, some cloud providers offer an option to view logs from a dead container and there are third-party (eg: Elastic/Metricbeat, NewRelic, etc) that preserve the history from all pods. If you only have direct access to the cluster, you can invoke kubectl logs <pod-name> –previous command.

kubectl get pods
At this point, you should be able to see if the error is due to an application issue or from some misconfiguration. Most pods stuck in a crash loop come from misconfiguration dealing with access to secrets or filesystems. Otherwise, you can check to see if the Dockerfile is the source of the problem by trying to run the container locally.
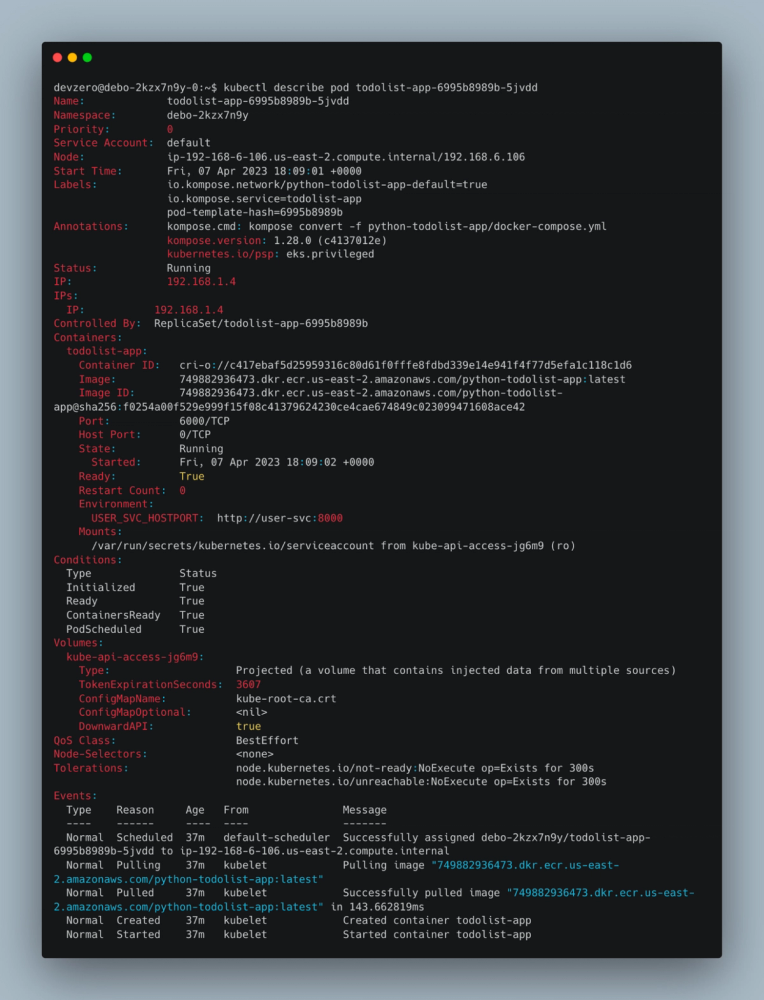
Next, if the pod is intermittently failing, we can look at the readiness or liveliness probes. If you used the default helm template to create your app, it may be failing on a health check that is not properly set up. Run the kubectl describe pod <pod-name> command or look at the Kubernetes event logs to see if it’s failing on the probes.

kubectl describe pod
Pod is Running but Unable to Access #
Finally, if your pod is running and deemed healthy by Kubernetes, and you are unable to access it, you should look at debugging Kubernetes services.
For engineers coming from the Docker and Docker Compose world where everything seems to “just work” by using the -p flag to map it to localhost or using the default network for compose files, Kubernetes networking may seem verbose and complicated. But remember that Kubernetes is orchestrating containers at scale, crossing multiple nodes, so it needs to be a bit more complex than default Docker networking.
Without diving too much into the details of Kubernetes services, there are few key concepts to understand:
- If your application only talks to some message queue or database, you don’t need a Kubernetes service.
- Kubernetes services are only needed if other containers or external traffic needs to talk to it.
- If the container only needs to talk to other containers in the same cluster, you need a service of type ClusterIP.
- If you need some external networking, you need a service type of NodePort or LoadBalancer. However, most likely your Kubernetes admin is using some ingress controller (e.g., nginx, istio gateway, traefik) so check with them first.
Now, I tend to see engineers confused on cases where their application should only talk to other services internal to the cluster, but for debugging, they would like to access it from their local computer. In this case, there are four common approaches:
- You may be temporarily given admin access via breakglass to either exec directly into the pod to run commands there (similar to docker exec ...).
- You may be given admin privileges to run the kubectl port-forward command to map services to localhost (similar to the `-p` flag in docker).
- There may be services exposed to internal load balancers that are accessible via VPN only.
- You may also have access via Kubernetes development tools such as DevZero's K8s product.
Check with your team to ensure you have access to at least one of these methods before moving forward.
At this point, you can run down this list of debugging steps to rule out some common issues:
- If you can exec into the pod and hit localhost, but not through a Kubernetes service either from another pod or port-forwarding, then you should inspect the service definition. Most likely the service is misconfigured, be sure it’s selecting the correct pod labels.
- If the labels seem correct, double check the target port matches the port you opened up via the Dockerfile.
- If you can access the service internally, but not from outside the cluster, it’s likely an issue with the ingress configuration. Ingress configurations are very specific to the type of ingress controller that is running, so reach out to your DevOps friends for help at this stage.
Wrapping Up #
Kubernetes is notorious for its steep learning curve and deservedly so. A lot of engineers are put off by the YAML hell and simply avoid dealing with debugging Kubernetes issues on their own. But by understanding a few key concepts related to pod lifecycles and networking, you can start to triage the most common failure scenarios and save yourself some time. Just being able to rule out some of these issues will go a long way to boosting your productivity with Kubernetes!
.svg)


.svg)
.svg)
.svg)


