It's no secret that the key to improving systems and processes is measuring progress through metrics. This rule also applies to your software development delivery process, which follows agile development methodologies and has multiple moving parts simultaneously.
So, is it possible to measure your software delivery performance? Well, yes, using methodologies like DORA—DevOps Research and Assessment—developed by Google. By using the DORA methodology, organizations can measure engineering delivery and performance and understand what makes a team successful at delivering high-quality applications and software. This blog post will explore what DORA is, what a DORA dashboard is, and some DORA metrics. Furthermore, we will learn how to build a DORA dashboard.
What Is a DORA Dashboard?
DevOps Research and Assessment (DORA) is a startup research program created by Gene Kim, Jez Humble, and Dr. Nicole Forsgren to measure and understand software delivery and performance. The startup was later acquired by Google in 2018 and currently creates reports that act as the industry's key benchmarks.
So, what is a DORA Dashboard?
A DORA metrics dashboard is designed with the sole aim of measuring and understanding software delivery performance. This dashboard provides stakeholders with the following:
- Provides visibility into the workflow process
- Helps identify areas that need improvements
- Helps with decision-making based on key metrics
Why Does the DORA Dashboard Matter in Software Development?
For starters, the DORA dashboard provides a comprehensive snapshot of your DORA metrics. This way, you can easily measure, track, and compare the team's performance and delivery velocity without manually calculating this. Thus, saving you a lot of time, especially if you can plug in the dashboard directly to your data sources like Jira, CI/CD pipelines, or GitHub repositories.
Overall, a DORA dashboard gives every stakeholder—developer, engineering manager, and executive—the metrics they need to align software velocity with goals, timelines, and expectations. It is also useful when benchmarking and making decisions for future sprints.
What Are the 4 DORA Metrics?
DORA measures and provides insights into the software delivery process using two key areas through four key metrics:
- Team velocity through deployment frequency and lead time for changes. By team velocity, we mean how fast they are building.
- Stability through time to restore services and change failure rate. By stability, we measure how robust the service is and how much downtime is experienced.
Now, let's break down these four metrics:
Deployment Frequency
Deployment frequency is a measure of how successfully the team pushes to production.
This metric measures how fast the engineering team is providing value to users. By value, we mean updates from new features and security patches to bug fixes. A high development frequency would indicate fast and frequent deployment, iteration, and successful value delivery. Remember, the deployment must be successful and "bug-free," or this will negatively impact your application and business.
Lead Time for Changes
Lead time for changes is all about how long it takes commits to get to production. Here, we factor in when the commit happened, the pull request time, and when someone successfully merged these requests into the repositories.
From an engineering standpoint, this metric measures the efficiency of CI/CD pipelines: how fast the team can take action and merge changes. This is very important when there is a service disruption and fixes must be shipped quickly.
Time to Restore Services
Mean time to restore (MTTR) or time to restore service (TTRS) is a metric that calculates how long it takes to recover from failure, downtime, or a system outrage in production.
To effectively calculate this, you will need to start collecting your data from the time the service went down to when the issue was resolved. A low TTRS is a strong indicator of team observability.
Change Failure Rate
Change failure rate measures how frequently pushed changes cause failure or a disruption in production.
It is calculated as the percentage of deployments that cause a disruption/failure in production within a certain period. This metric gives insights into the stability, throughput, and quality of code being shipped into production.
Get Your DORA Metrics with DevZero
Now that we've explored the four key metrics of DORA (DevOps Research and Assessment) let's explore how to create a development environment with DevZero. This practical tool lets you quickly build and test code with an on-demand, ephemeral, and ready-to-code development environment.

At DevZero, we created various dashboards that show the DORA metrics for popular repositories like Vue Router by Vue.js, Kubernetes, Cadence by Uber, and React by Facebook. We will soon support DORA for private repositories too. In the meantime you can connect your repo and start improving your metrics using cloud development environments by following the steps below.
DevZero offers developers the ability to create and manage their own development environments quickly and easily.
- Create a DevZero account by signing up if you don't have one. DevZero offers you an easily configured dev environment with a performant cloud IDE. Besides that, our workspace gives you access to fast virtual Kubernetes clusters to run anything on a virtual file system for your caches and wire guard-based network that will let you connect any two computers easily (personal VPC).
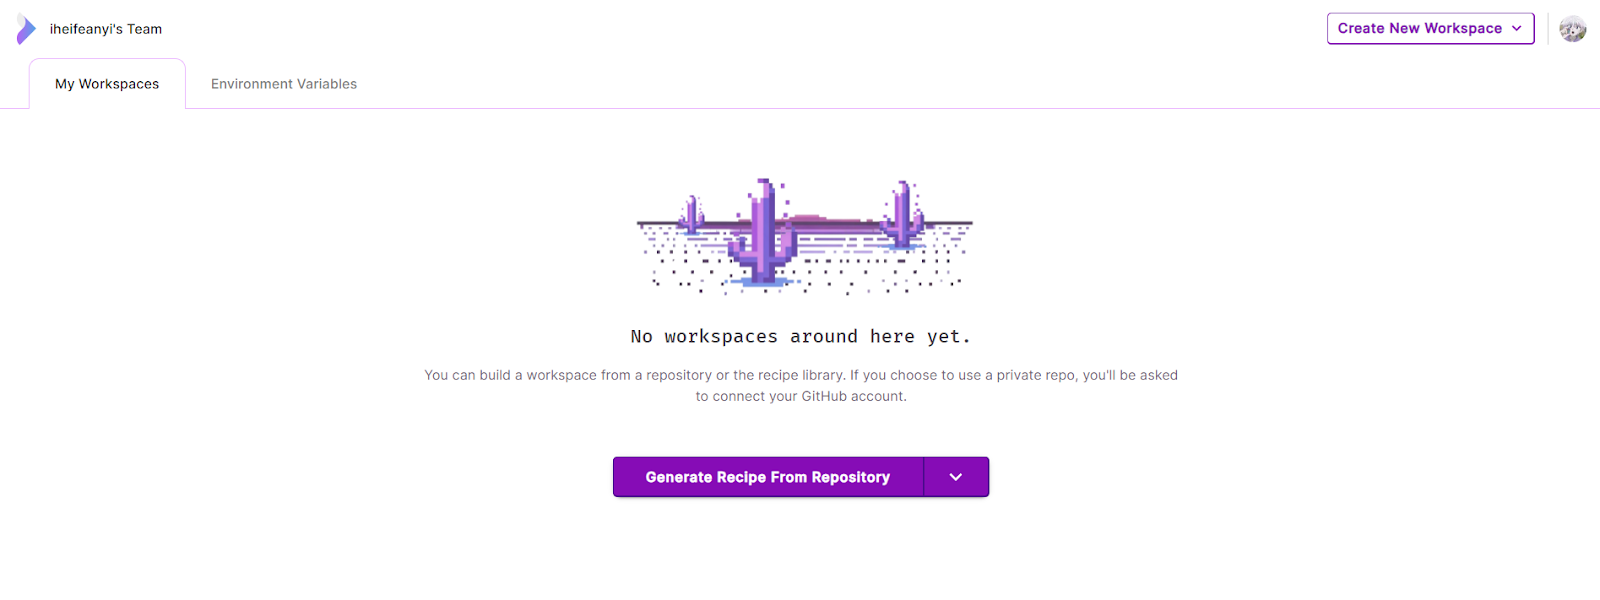
- Click on Create New Workspace to build a workspace from a repository or your recipe library. You can use a private repository; you just need to connect your GitHub account.

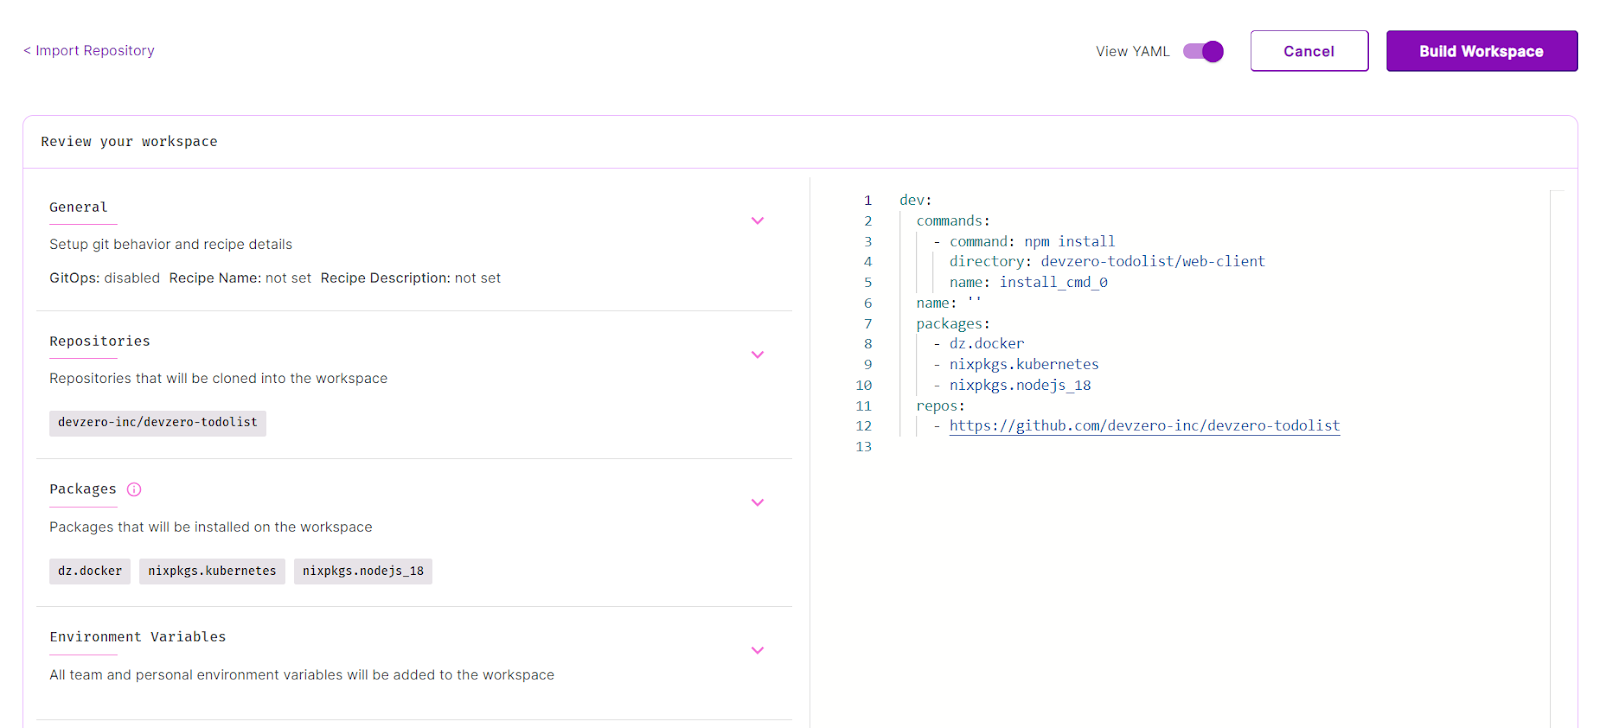
3. Paste your repo link. You can explore one of DevZero's public GitHub repositories. For this tutorial, we will use the devzero-todolist repo.
4. This will automatically import your repository. You can toggle on the View YAML to view the YAML build DevZero generates.

5. Click on Build Workspace. This takes a few seconds or minutes, depending on how large the repository is.

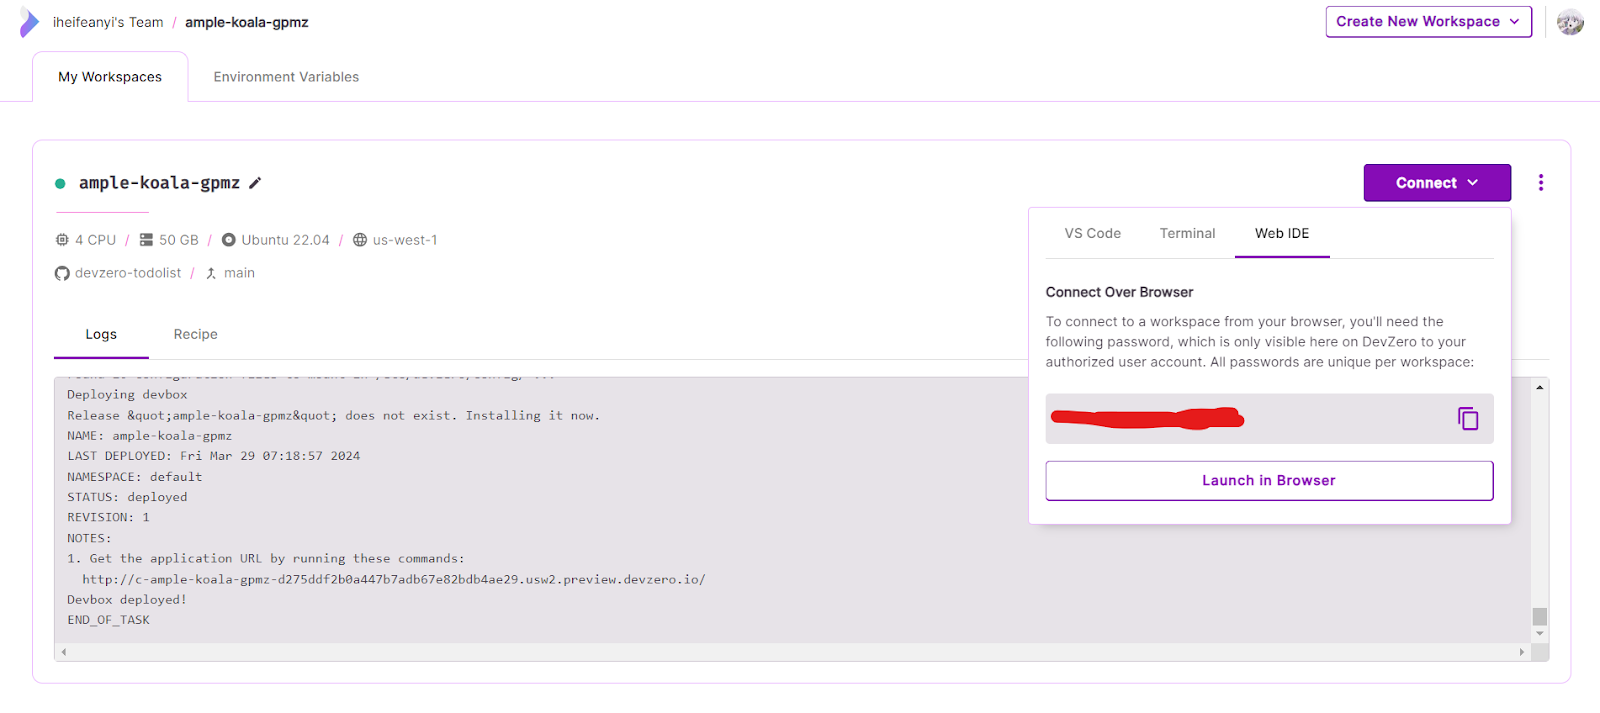
6. A workspace on DevZero offers you a faster version of your local computer, backed with Kubernetes clusters that is only available on a private network you can access.
7. Your workspace gets built automatically.

How to Use DevZero Locally
You can use the Web IDE option to connect to your workspace from your browser. Alternatively, you can connect to VS Code or your terminal locally. A local connection, however, requires a MacOS or Linux machine for any operations.
To do that, you will need to install and authenticate the DevZero CLI tool using the command below:
curl -fsSL https://api.devzero.io/backend/v0/cli/install-script | shAnd run the command if using VS Code:
dz ws code ample-koala-gpmzOr the command from your terminal:
dz ws connect ample-koala-gpmzUse the command below if you need help or want to see more commands:
dz --helpHow to Build a DORA Metrics Dashboard
DevZero makes it easy to build a DORA metrics dashboard. At a high level, visualizing your process involves a few steps:
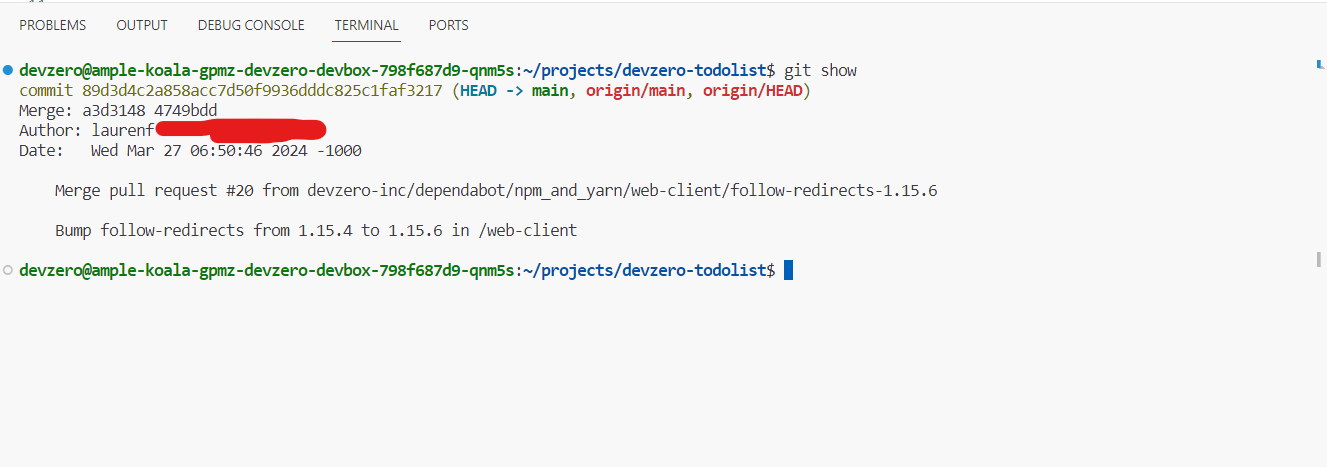
1. Open a new terminal on your VS Code locally or on your web IDE or locally.
2. Run git show. This shows various details—commits, hash, and branch—of an object in your repository.

3. Create a new file within file explorer or your IDE's menu.
4. Name this file analyze_commits.sh.
5. Navigate to the directory where you saved the analyze_commits.sh script.
6. Within this file, paste the script below to script extracts information—hash, author name, timestamp, insertions/deletions to files—using git show. This script also saves the output in a CSV file. Alternatively, you can parse that output and push it into a database.
#!/bin/bash


# Function to format the output


format_output() {


    local commit_hash=$1


    local author_name=$2


    local timestamp=$3


    local message=$4


    local action=$5


    local commit_time=$6


    local commit_author=$7


    local insertions_deletions=$8


    # Convert timestamp to month, day, and year format


    local formatted_date=$(date -d "@$timestamp" +"%b %d, %Y")


    # Output formatted data


    echo "\"$commit_hash\",\"$author_name\",\"$formatted_date\",\"$message\",\"$action\",\"$commit_time\",\"$commit_author\",\"$insertions_deletions\""


}


# Output CSV header


echo "Commit Hash,Author,Date,Message,Action,Commit Time,Commit Author,Insertions,Deletions"


# Loop through each commit


git log --format="%H|%an|%at|%s" | while IFS='|' read -r commit_hash author_name timestamp message; do


    # Run git show to get detailed information about the commit


    git_show_output=$(git show --stat --format='%at|%an|%T' "$commit_hash" | tail -n +5 | head -n -1 | awk 'BEGIN { FS = "|" } { insertions+=$1; deletions+=$2 } END { print insertions, deletions }')


    # Parse git show output


    commit_time=$(echo "$git_show_output" | cut -d' ' -f1)


    commit_author=$(echo "$git_show_output" | cut -d' ' -f2)


    # Determine action (merge, pull request, issue, comment)


    if echo "$message" | grep -iqE '^(merge|pull request|issue|comment)'; then


        action=$(echo "$message" | grep -ioE 'merge|pull request|issue|comment')


    else


        action="None"


    fi


    # Format output


    formatted_output=$(format_output "$commit_hash" "$author_name" "$timestamp" "$message" "$action" "$commit_time" "$commit_author" "$git_show_output")


    # Output to CSV


    echo "$formatted_output"


done > output.csv
7. Navigate to the script’s root directory using this cd command:
cd /path/to/your/project8. Run this command to make the script executable:
chmod +x analyze_commits.sh9. Run this command to get the details:
./analyze_commits.sh10. Take a look at the output.csv file with your project directory.

11. Visualize your data using a visualization tool of your choice. You can make use of Power BI, Tableau, or Metabase.
To streamline the process, the output can be parsed and stored in a database, enabling automated generation of weekly metrics through queries.
Are Dora Metrics Enough?
DORA is a great methodology that gives stakeholders insights into the delivery and team performance. However, it only tells part of the story.
For one, DORA only measures performance, delivery, and efficiency, not overall performance, developer experience, or even developer productivity. There are also flow metrics—cycle time, throughput, flow efficiency, and work in progress—which measure everything from ideation to production. Another issue is the fact that different teams within the same organization calculate DORA differently; thus, it is important to standardize this in your organization.
Overall, DORA metrics are good metrics, but don't stop there. Factor in other metrics like developer productivity. We have a great tutorial that shows how to calculate developer productivity. Use the results from these various measurement techniques to improve and optimize your team workflow. A great starting point is investing in a tool like DevZero, which is seamless and pretty easy to use.
So get started with DevZero today!
This post was written by Ifeanyi Benedict Iheagwara. Ifeanyi is a data analyst and Power Platform developer who is passionate about technical writing, contributing to open source organizations, and building communities. Ifeanyi writes about machine learning, data science, and DevOps, and enjoys contributing to open-source projects and the global ecosystem in any capacity.
.svg)


.svg)
.svg)
.svg)


.webp)


